Optimise your Micro:Bit code with Chrome DevTools
Originally posted on the Scott Logic blog
When I wrote a ray tracer for the BBC Micro:Bit, I didn't expect it to be fast. I was right - my first attempt was unbearably slow, taking multiple seconds to respond to a button press. That meant I had to optimise my code, but the normal MakeCode IDE doesn't provide any tools to let you inspect your program while it's running. Instead, I reworked my code to run as a website and used Chrome's Developer Tools. My test bench code is available on GitHub.
This post walks you through how to build a test bench website for your code and use the Chrome Developer Tools to optimise it. It is aimed at more advanced Micro:Bit users, but you don't need any experience with HTML or web development in general. However, you will need a basic grasp of using the command line to navigate between folders and run commands.
Introduction to Profiling
When it comes to optimising your code, there are a lot of general tips I could give you. However, I can't give advice about your specific project. Thankfully, you can use a tool called a profiler for that.
Profilers inspect your program during execution and generate a report. The report lists how often each function ran and how long they took. It also tells you how much memory was used, and where in your code the memory was allocated. This helps you find the 'hot spots' in your code - the parts that are running frequently and taking a long time.

In general, a profiler lets you know which bits of your code are causing slowness and need optimising. Since optimisation usually makes your code harder to read and maintain, this information comes in handy. We only want to optimise the parts of the code that need it most.
The MakeCode IDE doesn't include a profiler, but we can rework our code to let us use a normal JavaScript profiler. Google Chrome has a JavaScript profiler built-in, and you can run it on any website using the Chrome Developer Tools. In fact, Chrome is not unique here - most browsers include profilers in their developer tools. In this post, I'll focus on Chrome's profiler, so make sure you are using Chrome too if you are following along at home.
Building a Test Bench
Since Chrome's profiler only works on websites, we can't use it to profile your Micro:Bit project directly. Instead, we need to build a website that runs your code - known as a test bench. That could be as simple as:
Simple Test Bench
<html>
  <head>
    <script src="./myCode.js"></script>
  </head>
</html>
However, this only works if your program is pure JavaScript.
Most Micro:Bit code uses the handy built-in functions, like input.onButtonPressed or basic.clearScreen.
We will need to write some extra code to let us use those functions, known as stubbing them.
Stubbing a function means writing a simpler version of it, which can be used in place of the real version.
For example, you could stub radio.sendString with a function that just writes the value in a text box.
You could stub input.onButtonPressed like this:
Test Bench Stubs
const Button = {
  A: "a",
  B: "b",
  AB: "ab",
};

let aPressed = () => {};
let bPressed = () => {};
let abPressed = () => {};

const input = {
  onButtonPressed: (button: string, func: () => void) => {
    if (button === Button.A) aPressed = func;
    if (button === Button.B) bPressed = func;
    if (button === Button.AB) abPressed = func;
  },
};
Now, other parts of your code can call input.onButtonPressed just like on a real Micro:Bit.
The final step is to add some HTML buttons to your test bench.
When the A button is pressed, it should run the aPressed function from the stub.
Test Bench
<html>
  <head>
    <script src="./myCode.js"></script>
  </head>

  <body>
    <button onClick="aPressed()">A</button>
    <button onClick="bPressed()">B</button>
    <button onClick="abPressed()">AB</button>
  </body>
</html>
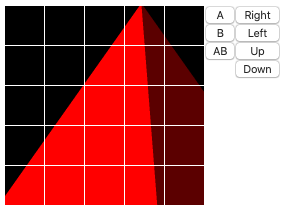
If you need a second example, you can look at my ray tracer's test bench. There, I stubbed the LED screen using HTML canvas. The resulting website looks like this:

Stubbing the Micro:Bit methods can be really hard at first, and it's often unclear what approach to take. Therefore, before you jump in and start stubbing the methods, you should think about whether you really need them. If your only goal is to test the performance of your program, do you really need to see the output of the LED display? If not, you can just comment out any lines that use the Micro:Bit functions.
It's also important to remember that your computer is much faster than the Micro:Bit. That means that your code could run so quickly that it finishes before the profiler records any data! That happened in my case, so I had to increase the number of pixels in my ray tracer until it took a few seconds to run. You could even just run your program over and over again in a loop.
An Important Note
The 'JavaScript' code used by the Micro:Bit is actually TypeScript. TypeScript isn't natively supported by the browser, so we have to transpile it into JavaScript. The method is quite straightforward:
- Install npm by clicking the link and following the instructions for your operating system
- Install TypeScript by running
npm install -g typescriptin the command line - With your code in a file named
myCode.ts, navigate to that folder and runtsc myCode.ts
The compiled JavaScript will be written to a file called myCode.js, ready to be used in your test bench.
You'll need to repeat the last step any time you make changes to myCode.ts.
Using the Profiler
Open up your HTML file and check that your code is running.
If you haven't set up any outputs, it could be hard to tell - try adding console.log("It's working!") somewhere in your code.
After recompiling and refreshing the web page, you should see the message printed in the console.
To access the console, open developer tools by right-clicking on the page and selecting Inspect Element.
Then, switch to the Console tab.
Now we know that's all working, it's time to start inspecting your code.
There are two tabs that we're interested in: Performance and Memory.
The Performance tab shows you how long each function is taking, both on a per-call level, and in total.
The Memory tab shows you where memory is being allocated and how much is being used while the program was running.
Performance
In the performance tab, press the circular Record button and start running your program.
After a few seconds, press the button again to stop recording and wait for it to process.
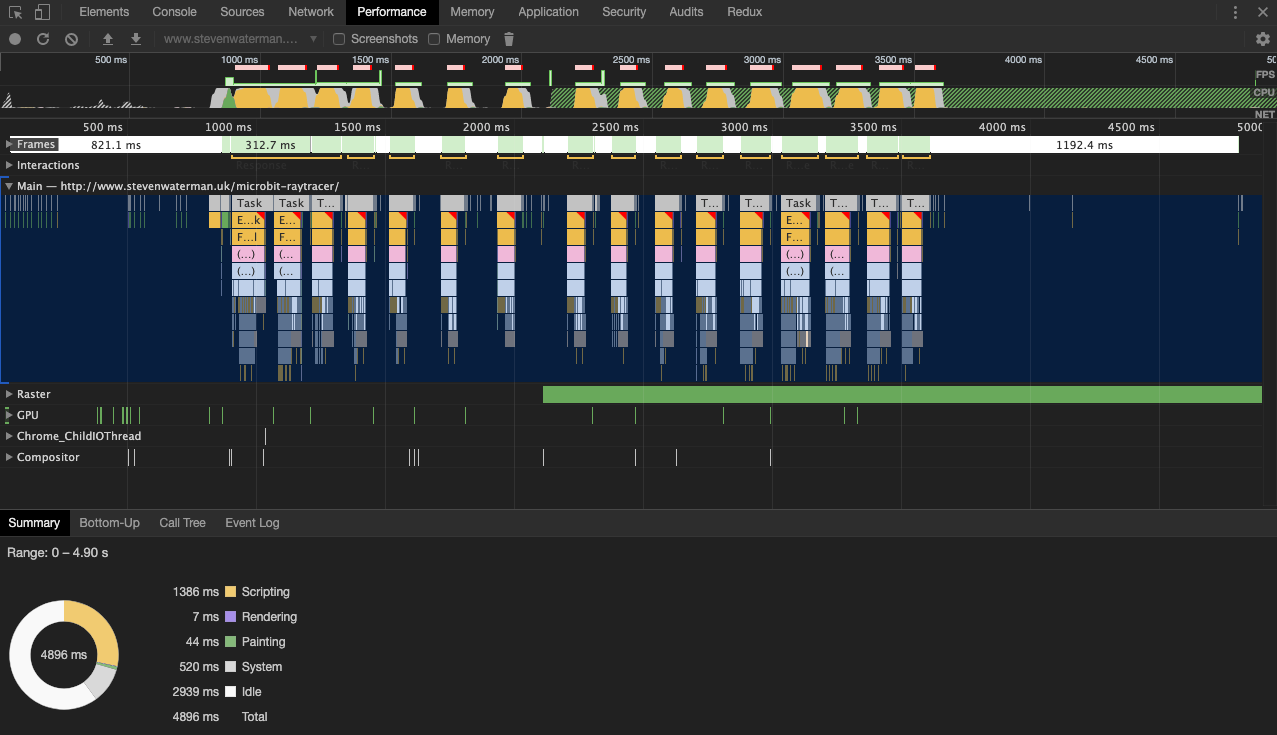
You should see something like this:

Time increases from left to right, and each rectangle is the function in your code that was running at the time. When one function is under another, it means that the bottom one was called by the top one. The name of the function is written on the rectangle. Zoom in and see which functions are taking the longest in your code. Those functions are the ones that you should try to optimise.
I'm not going to discuss how to optimise your code, because it's an entire topic in itself. A few techniques I'd recommend looking into are:
- Memoization: When a function is called with some arguments for the first time, the result is stored in a lookup table. On future calls, the arguments are used to get the result from the lookup table, instead of computing it again.
- Function Inlining: Copying the contents of a function into the part of the code where you previously called that function, allowing you to remove the function. This is useful when a function gets called millions of times as each function call introduces a tiny delay.
- Precomputation: Calculating every possible result of a function externally and hard-coding it into your program. This helps when the range of arguments is very small and known in advance, but the calculation is so complex that there's no realistic way to run it on the Micro:Bit.
- Lazy Loading: Only calculate things when you're absolutely sure the result will get used. This is a good general principle to look out for in any project, and helps reduce wasted CPU time.
In the performance profiler, you may see that your program spends a lot of time doing *garbage collection* (GC). This happens when you use lots of memory in your program. High memory use means the JavaScript interpreter constantly has to pause execution and tidy up after you. If that is the case in your code, you should check out the Memory tab.
Memory
The memory tab works just like the performance tab.
First, select the Allocation Sampling profile, then hit Start.
Your code will run much slower while the memory profiler is running, so let it run for a while before clicking to stop the recording.
After giving it a few seconds to generate the report, it should look something like this:

The default view is Summary but you should change that to Containment.
Then, click to open the Window / <your url> category.
Here, you will see all of the memory allocated by your code.
The amount of memory allocated is written in the far-right column, Retained Size.
Just to the left of that, it says which line of code allocated the memory, e.g. myCode.js:85 means line 85.
Look for any of your methods near the top of the list - those are the ones that are using the most memory and need fixing.
The following code is an example of a function with high memory use because it creates a new object each time it gets called:
High Memory Usage
function getRange(values: number[]) {
  return {
    min: Math.min(values),
    max: Math.max(values),
  };
}
To reduce the memory use of a function like that, try removing any object creation and instead store the result in a global variable.
In our case, we could use two global variables, minResult and maxResult:
Low Memory Usage
let minResult: number = 0;
let maxResult: number = 0;

function getRange(values: number[]) {
  minResult = Math.min(values);
  maxResult = Math.max(values);
}
Alternatively, you could create one object in a global variable and simply mutate its properties, like this:
Global State
const rangeResult = {
  min: 0,
  max: 0,
};

function getRange(values: number[]) {
  rangeResult.min = Math.min(values);
  rangeResult.max = Math.max(values);
}
Using the profiler, you should be able to incrementally improve your code, focusing on the parts that need it most. That incremental approach lets you optimise as little of your code as possible, while still seeing positive results overall.
Conclusion
A profiler is a great way to start intelligently optimising your code. They help you focus your efforts on the areas that would benefit most from being optimised. Since optimisation usually makes your code harder to read and maintain, it's important to only optimise those 'hot spots'.
Hopefully, with the help of a profiler, you'll be able to take your Micro:Bit code to new heights!
If you're interested in reading more about how profilers can be used to optimise code, check out one of my older blog posts Slow Code HATES him! Optimising a web app from 1 to 60fps.
